- square matrix that describes relationship between 2+ random vars in dataset
- captures how features vary together
- measures spread of a set of points around their center of mass (mean)
- variance measures deviation from the mean for points in one dim
- covariance is how much each of the dimensions var from mean w respect to each other
- cov is measured btw 2 dims to see if there is a relationship between 2 dims
- cov btw one dim and itself = variance
covariance between dimensions example
- dataset of students, where each student has
- x: num hours studied
- y: grades obtained
- z: num lectures attended
- covariance val btw x and y is 104, what does this val mean?
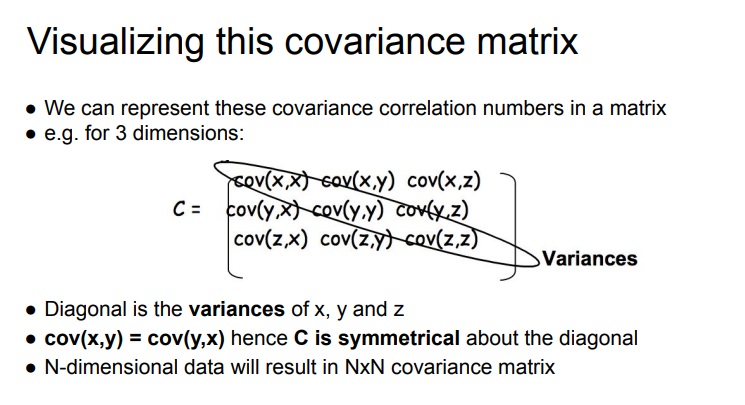
- represent covariance correlation numbers in a matrix
- sign matters more than value
- positive: both dims increase or decrease together (ex. hours studying vs grades)
- negative:
- one increases when other decreases (ex. social life vs. grades)
- zero:
- two dims are independent (ex. student height vs. grades)